
Stability Analysis
Turn impedance data into actionable stability insight with Nyquist views, closed-loop response plots, modal identification, and multi-bus participation analysis.
From impedance data to engineering decisions
Once subsystem impedance or admittance data is available, the next question is usually: is the interconnected system stable, and if not, where should we focus?
The analysis workflow uses impedance-based stability methods that separate a system into two subsystems, form the relevant open-loop or closed-loop response, and present the results in plots that are straightforward to read.
Open-loop and closed-loop views
Rezonance supports complementary ways of examining the same system behaviour:
| Analysis view | Typical question it answers |
|---|---|
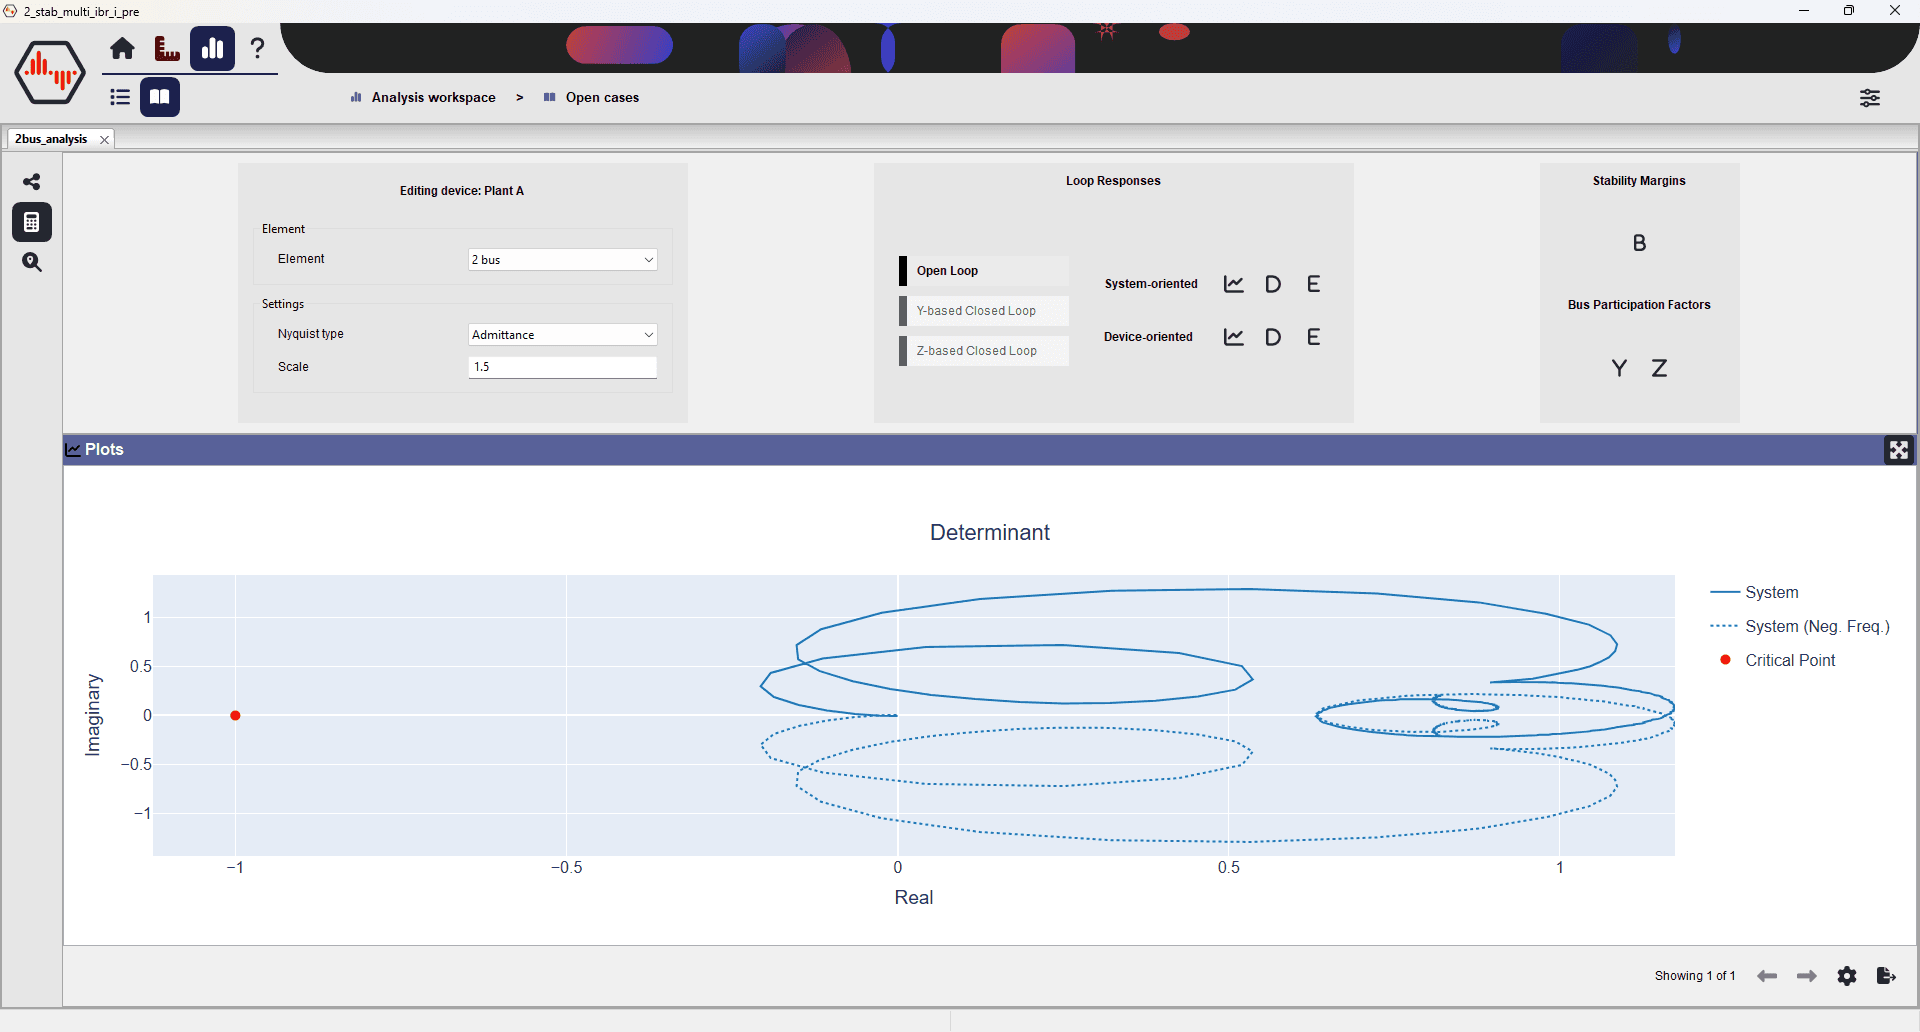
| Determinant / eigenloci Nyquist plots | Is the system approaching or crossing a critical stability boundary? |
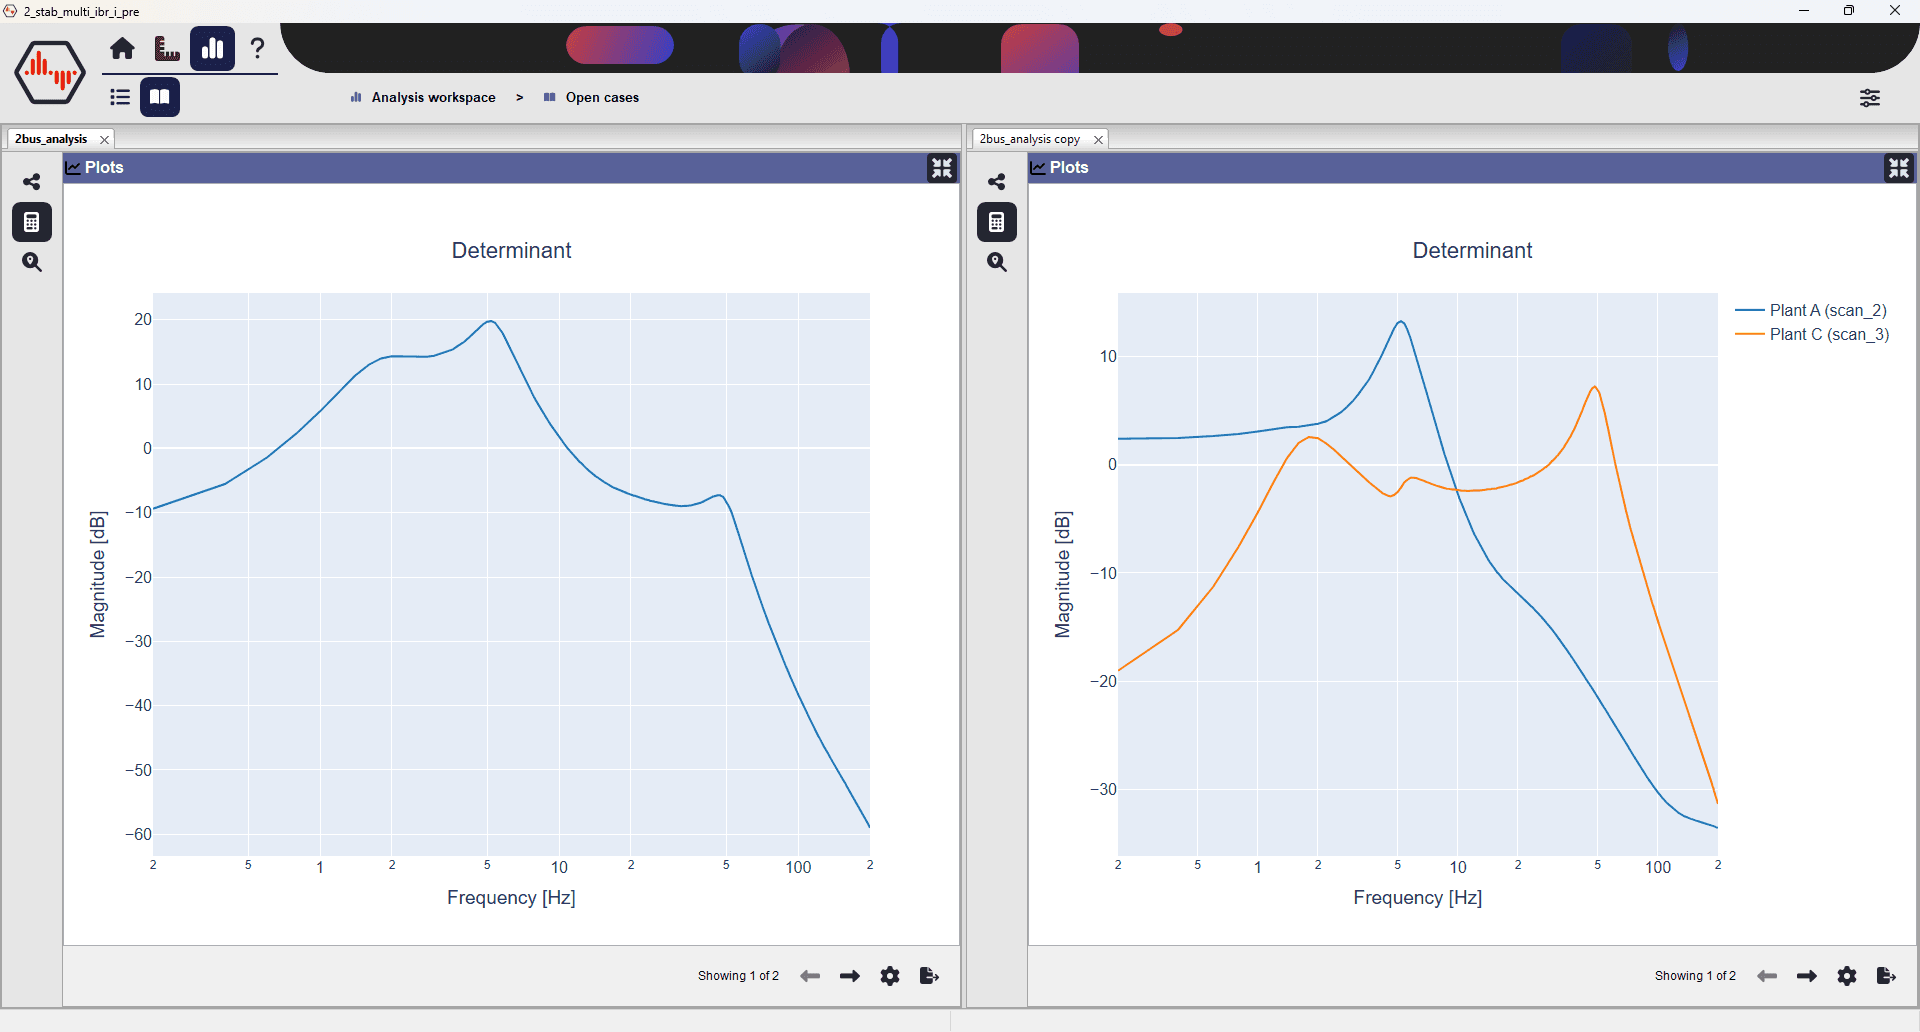
| Closed-loop response plots | Where are the poorly damped oscillatory modes, and how severe are they? |
| Multi-bus participation analysis | Which buses or plants are most associated with a problematic mode? |
| Modal identification | What are the frequencies and damping values of the dominant modes? |
This lets an engineer move from a quick stability screen to a much more targeted investigation without switching tools or rebuilding the study context.
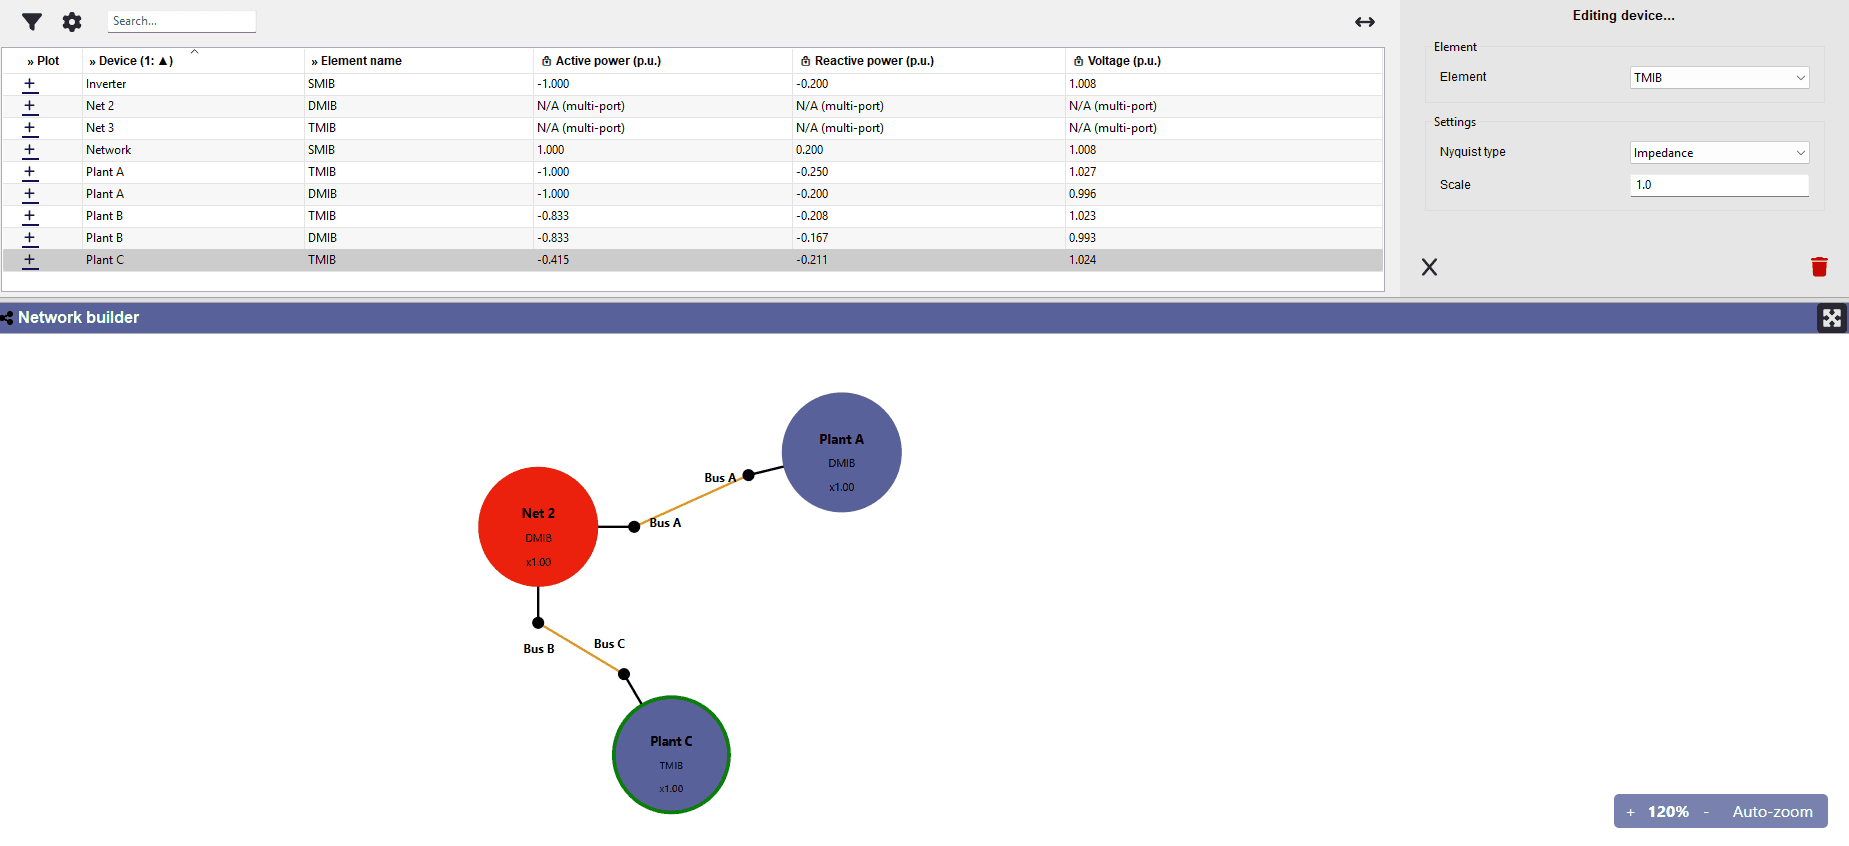
Device-level analysis for multi-bus systems
For wider systems, Rezonance offers device-level (plant-level) analysis. Rather than grouping all plants into a single subsystem, this approach isolates one plant at a time against the rest of the system. The result is a per-plant closed-loop frequency response, and the plant with the strongest peak at a given frequency is typically the one driving that mode.
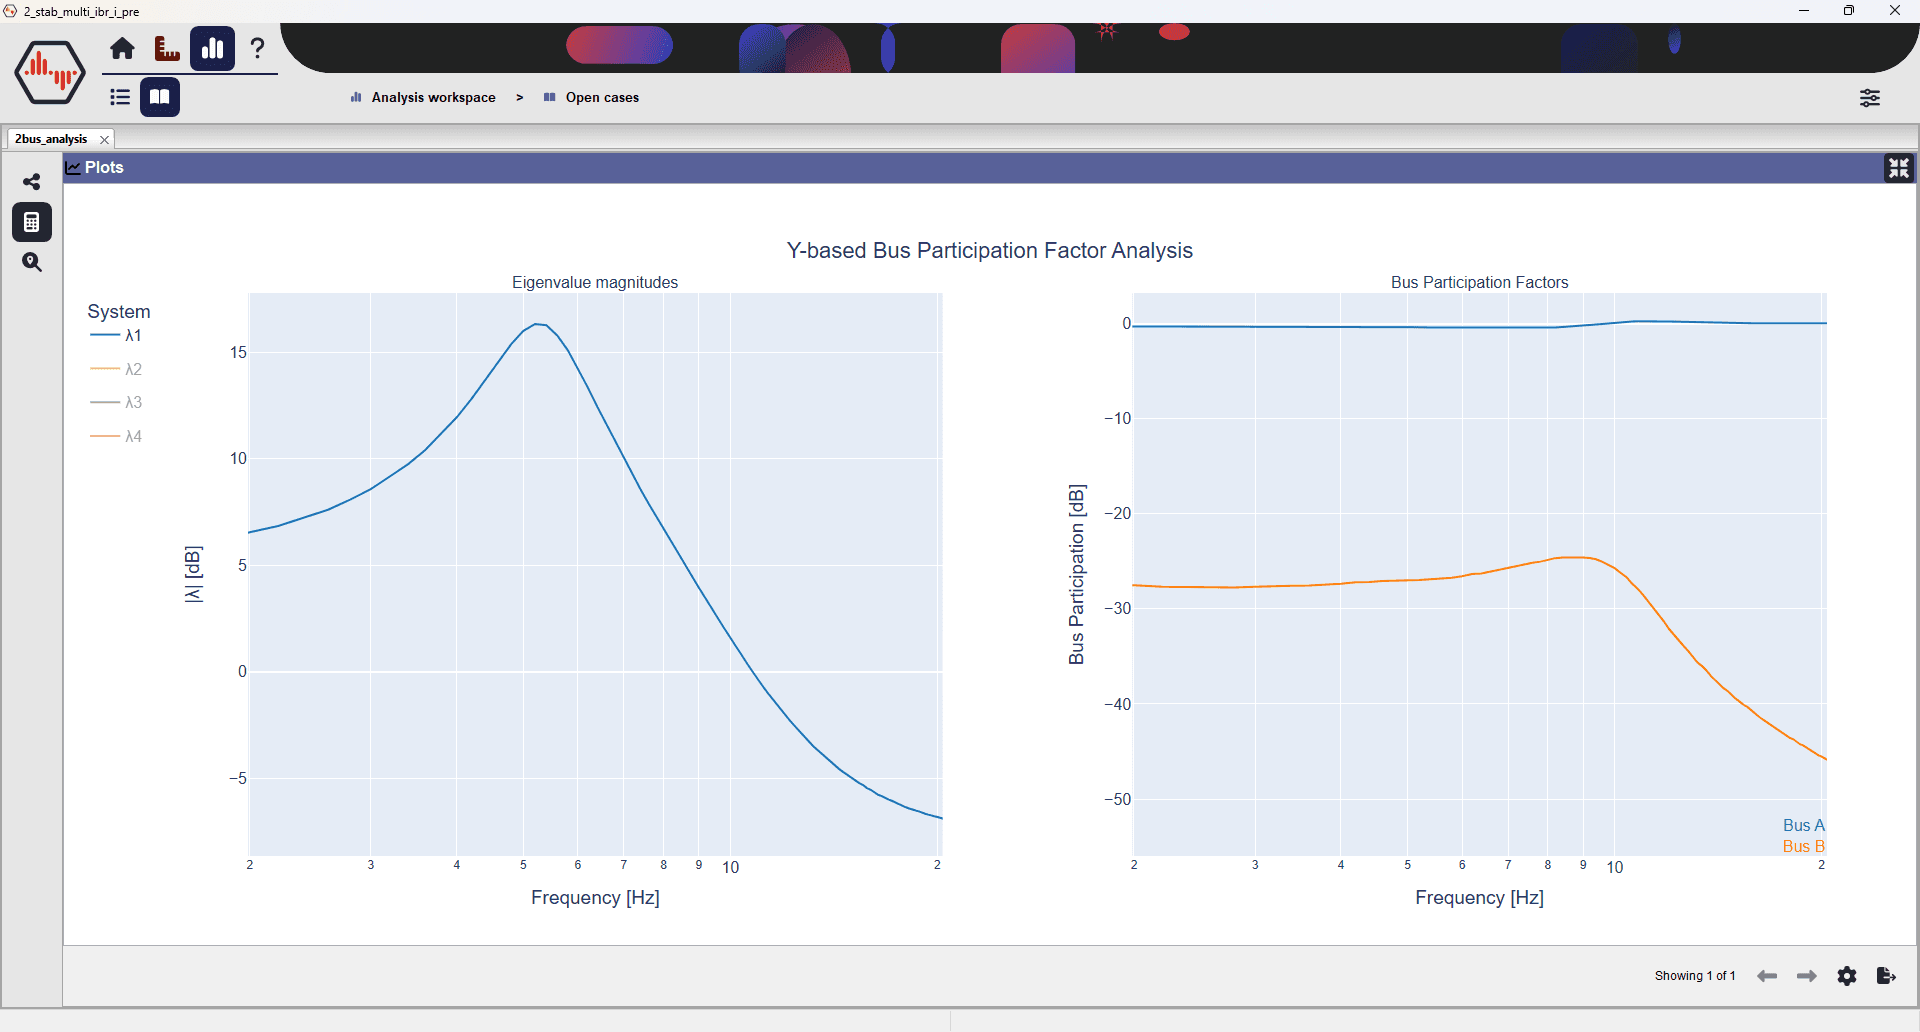
Bus participation factors
A complementary view uses eigenvalue decomposition to quantify how much each bus contributes to an oscillatory mode. At the peak frequency, a Bus Participation plot shows relative plant contributions in dB, making it straightforward to identify which plants are most involved.
Together, device-level analysis and bus participation factors give two ways to trace a system-wide mode back to the specific plants responsible.
Modal identification
Once closed-loop peaks flag modes that deserve attention, the next step is to quantify them. Rezonance extracts frequency and damping estimates through modal identification, giving teams concrete numbers instead of just visual impressions of resonance peaks.
Practical benefits
- Compare operating points or short-circuit strength assumptions quickly.
- Use the same project data generated during scanning, no need to rebuild results elsewhere.
- Move from technical evidence to stakeholder-ready conclusions with clear plots.
- Investigate both local plant issues and broader network interactions in the same environment.
Stability analysis is most useful when it leads to understanding what drives an oscillation and where mitigation effort should go.
Keep exploring Stability Analysis
Dive further into the Rezonance workflow, compare capabilities, and see how this feature fits into the broader analysis platform.
Explore all features